More than 1.5 million crashes involving live animals were reported on U.S. roads between 2020 and 2024, including over 155,000 injury crashes and 948 fatal crashes. The risk rises during deer season, as animals become more active and shorter daylight hours make them harder for drivers to spot.
For our study, The Deadly Toll of Deer Season on America’s Roads, Levine And Wiss analyzed findings from the National Highway Traffic Safety Administration (NHTSA), State Farm, AAA, the Insurance Institute for Highway Safety (IIHS), and New York transportation agencies. Our research examines national animal-collision patterns, the seasonal increase in deer crashes, and the substantial differences between communities across Long Island.
West Virginia leads the nation in animal-collision insurance-claim likelihood, while Pennsylvania records the highest estimated claim volume. On Long Island, Suffolk County reported nine times as many animal-related crashes as Nassau County in 2024, despite having a population only about 10% larger.
Where Animal Collisions Are Most Likely Across America
West Virginia has the highest modeled likelihood of an animal-collision insurance claim in the country, with odds of 1 in 46, according to State Farm’s September 2026 analysis. Montana follows at 1 in 54, and Wisconsin ranks third at 1 in 62.
Nationwide, State Farm estimates more than 1.6 million animal-collision insurance claims occurred between July 2025 and June 2026, with an average modeled claim likelihood of 1 in 145.
The 10 States With the Highest Animal-Collision Claim Likelihood
Analysing State Farm’s 2026 data, we found these states have the highest modeled likelihood of an animal-collision insurance claim:
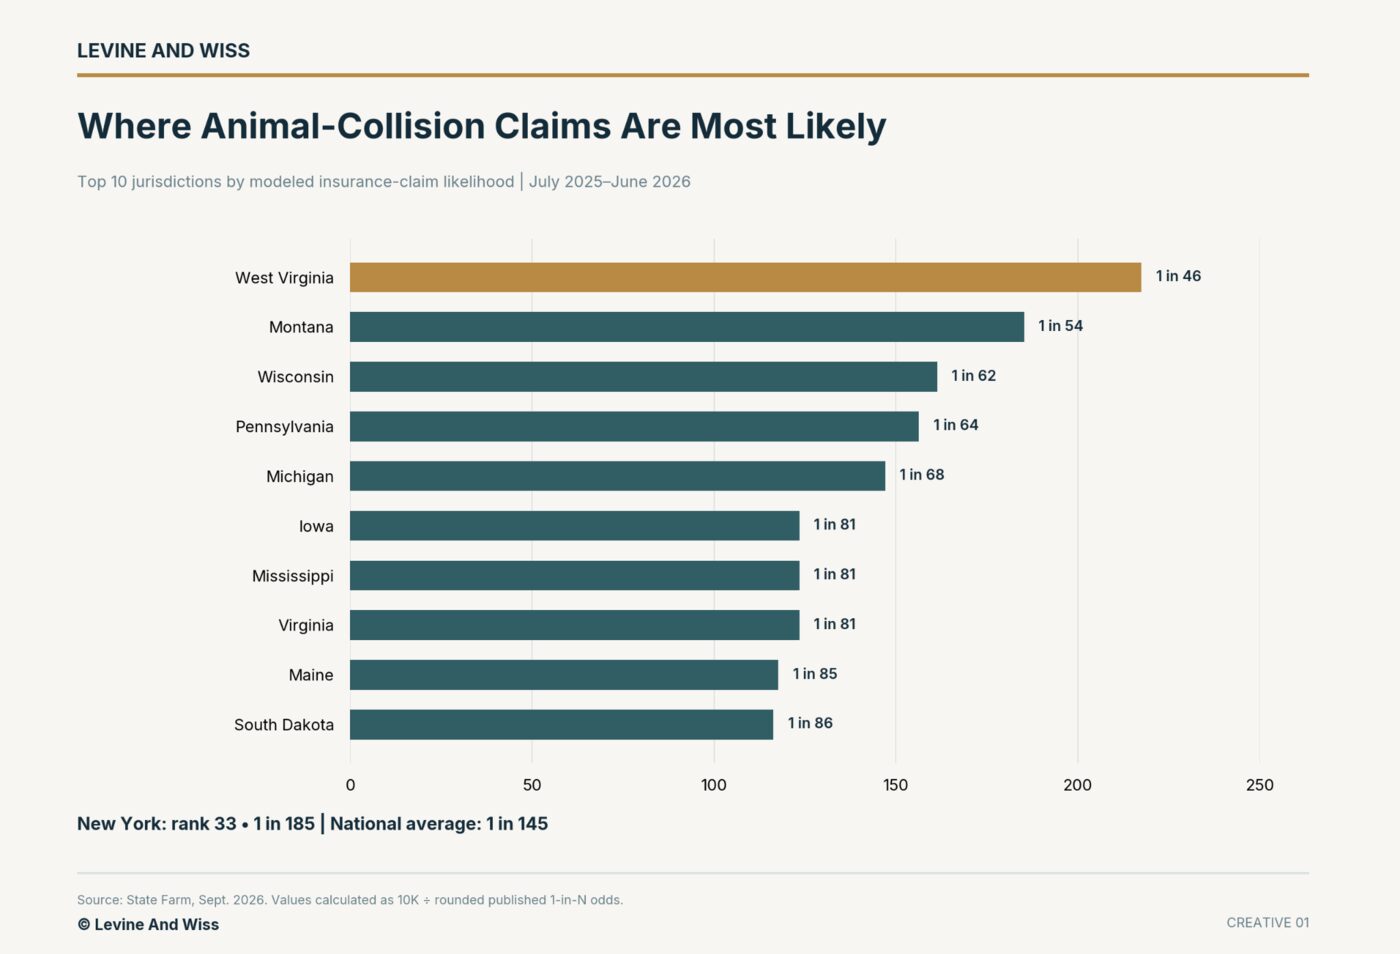
These rankings reflect insurance-claim likelihood, not the total number of collisions. Pennsylvania, for example, ranks fourth for claim likelihood but leads the nation in estimated claim volume, with approximately 141,000 claims. States with larger populations and more insured vehicles can generate higher claim totals without ranking highest for claim probability.
How Does New York Compare With Other States?
New York ranks 33rd among the 50 states and Washington, D.C., with a modeled animal-collision claim likelihood of 1 in 185. Based on State Farm’s rounded estimates, West Virginia’s likelihood is approximately four times New York’s. At the opposite end of the rankings, Hawaii has the lowest modeled likelihood at 1 in 852, followed by Nevada at 1 in 838.
The national estimate also changed from 1 in 139 in the previous State Farm analysis to 1 in 145 in 2026. That movement reflects the insurer’s modeling and does not necessarily indicate a corresponding decline in police-reported animal crashes.
NHTSA’s police-reported crash figures and State Farm’s insurance-claim estimates measure different events and reporting periods. Neither dataset establishes an individual driver’s probability of injury. New York’s statewide ranking also provides little indication of how animal-crash totals differ between Suffolk and Nassau Counties.
Long Island’s Animal-Crash Divide: Counties, Towns, and Road Types
New York recorded 36,743 police-reported animal-related crashes in 2024, according to AAA Western and Central New York. Suffolk County accounted for 1,555 incidents, ranking third statewide behind Orange County, with 1,656, and Monroe County, with 1,565.
Neighboring Nassau County recorded just 172 animal crashes during the same year. Suffolk’s total was approximately nine times Nassau’s, despite the counties sharing Long Island and having populations of comparable size.
Suffolk County Had 8.2 Times Nassau’s Resident-Adjusted Crash Frequency
To examine the county differences more closely, Levine And Wiss compared reported animal crashes against 2024 U.S. Census Bureau population estimates.
Our analysis found:
- Suffolk County: 1,555 reported animal crashes among 1,543,330 residents, equivalent to 100.8 crashes per 100,000 residents.
- Nassau County: 172 reported animal crashes among 1,397,783 residents, equivalent to 12.3 crashes per 100,000 residents.
After adjusting for population, Suffolk’s reported animal-crash frequency remained approximately 8.2 times Nassau’s, showing that population size alone does not explain the gap.
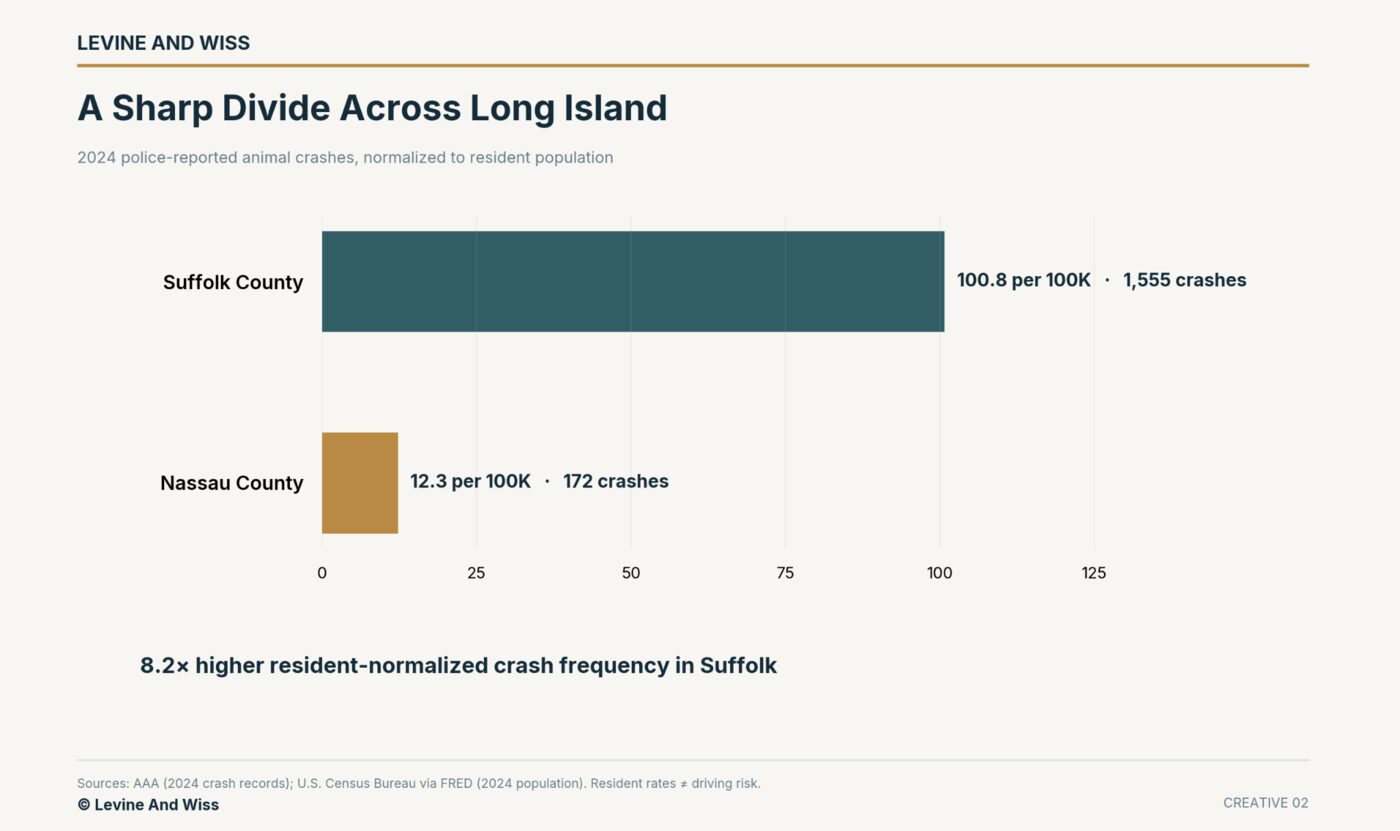
The figures represent reported crashes relative to each county’s population. They do not account for miles driven, traffic volume, or vehicles traveling into a county from other areas. Consequently, they should not be interpreted as an individual driver’s likelihood of striking an animal.
Suffolk’s geography offers context for the difference. The county includes established suburbs, wooded areas, and less-developed portions of Long Island’s East End. Roads pass through or border areas where deer live, creating opportunities for encounters even within residential communities.
Three Suffolk County Towns Rank Among New York’s Highest for Deer Crashes
AAA Northeast’s analysis of deer crashes from 2021 through 2024 identified three Suffolk County municipalities among the state’s 10 highest for reported incidents:
- Southold: Ranked first statewide, with 790 deer crashes.
- Brookhaven: Ranked sixth, with 599 deer crashes.
- Southampton: Ranked 10th, with 526 deer crashes.
Together, these municipalities accounted for 1,915 reported deer crashes over four years. Southold recorded the highest total of any New York municipality, exceeding second-place Wallkill’s 746 crashes by 44.
Elsewhere in New York, Canandaigua recorded 670 deer crashes, Victor recorded 646, and Orchard Park recorded 617. These municipalities also ranked among the state’s highest for reported deer collisions from 2021 through 2024.
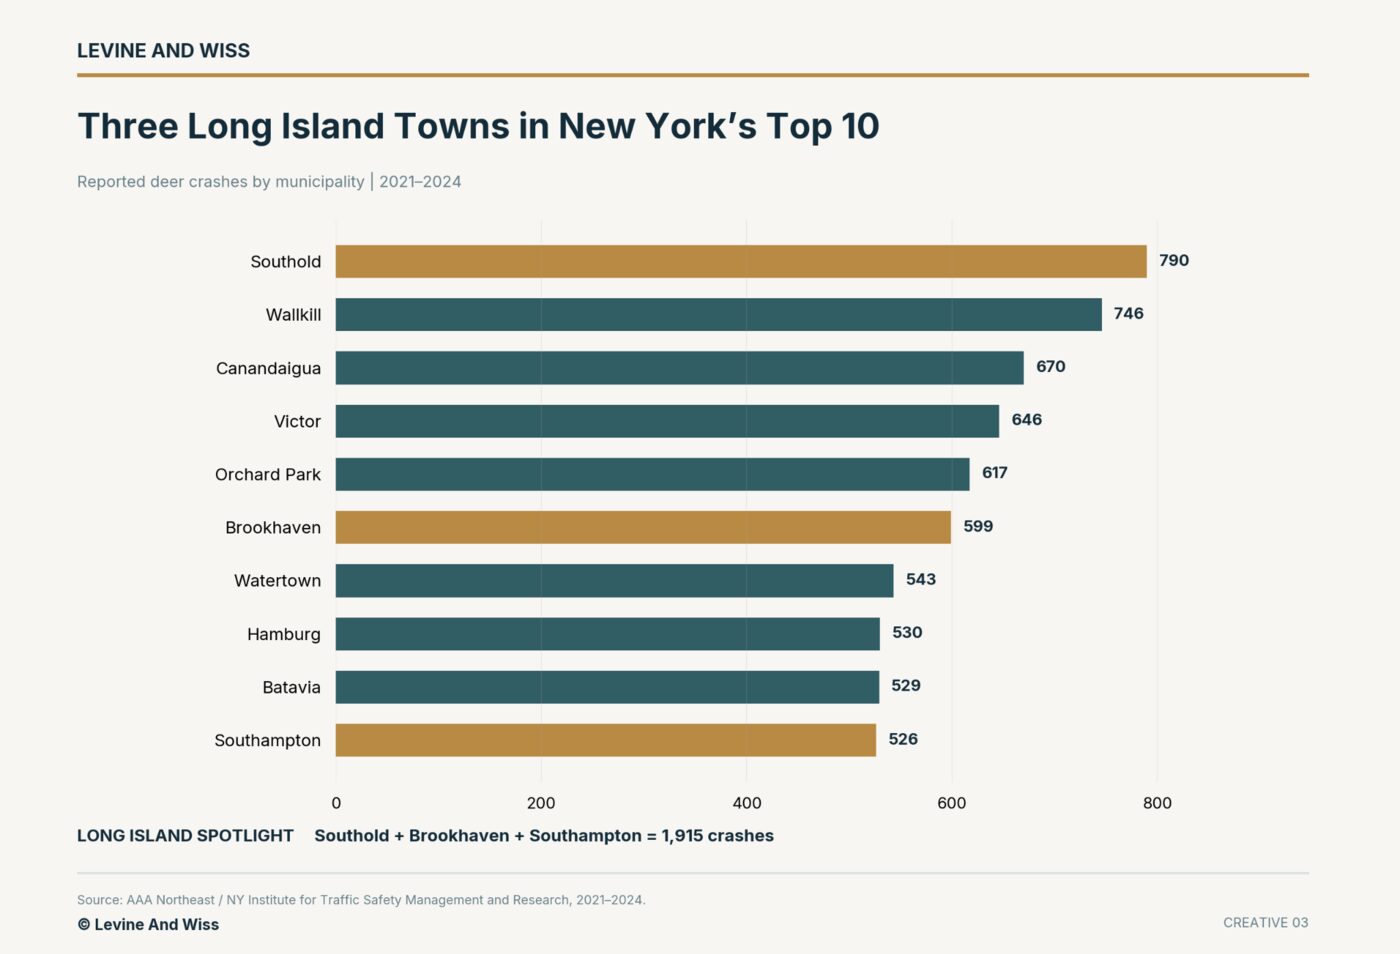
These rankings cover deer-specific collisions from 2021 through 2024, whereas the Suffolk-Nassau comparison concerns all reported animal crashes during 2024. The two datasets help identify geographic concentrations but should not be combined into one annual total.
Why Animal Collisions Affect Both Rural Roads and Suburban Communities
Historical Federal Highway Administration (FHWA) research found that 89.7% of animal-vehicle crashes with recorded lane counts in one national sample occurred on two-lane roads. Because this statistic describes road configuration rather than a rural-versus-suburban crash rate, it does not establish which setting has a higher collision frequency today.
Two-lane roads connect rural communities, residential neighborhoods, and commercial areas. The surrounding habitat, roadway configuration, and amount of vehicle traffic can all influence where animal encounters occur. AAA Northeast has also noted that residential development increasingly overlaps deer habitat, bringing wildlife into suburban and urban settings.
Southold, Brookhaven, and Southampton offer three examples of how deer crashes can concentrate in communities with different development patterns. Each ranked among New York’s 10 highest municipalities for reported deer collisions from 2021 through 2024.
Which New York Roads Have the Highest Animal-Collision Counts?
The reviewed research does not establish a verified statewide ranking of New York roads by animal-collision totals. However, the Ithaca-Tompkins County Transportation Council’s 2018–2022 analysis identified 45 deer crashes among 82 total crashes on a section of Route 13 in Newfield and 37 among 59 on a section of Route 34B (Ridge Road) in Lansing. Two sections of Route 89 in Ulysses recorded 35 and 34 deer crashes, respectively. These findings identify local road segments with substantial deer-crash counts, not the roads with the highest animal-collision totals statewide.
The New York State Department of Transportation also maintains the Crash Location and Engineering Analysis Repository (CLEAR), although access to detailed roadway records varies. These resources can identify local crash concentrations, but do not provide a comparable public ranking of every road in the state.
Why November Is New York’s Peak Deer-Crash Month
November is New York’s peak month for reported deer crashes, according to AAA Northeast’s October 2026 analysis. Of the 126,321 deer crashes recorded statewide from 2021 through 2024, more than 20% occurred during November alone. More than 37% of crashes during those four years occurred between September and November.
The increase coincides with deer mating season, commonly called the rut, when deer become more active and travel farther in search of mates. That movement can bring them across roads unexpectedly, particularly as shorter daylight hours make them harder for drivers to spot. New York’s DMV and DEC identify these seasonal changes as contributing factors in deer collisions.
The seasonal pattern extends beyond New York. According to AAA Northeast’s analysis of NHTSA data, more than 40% of reported U.S. animal crashes from 2020 through 2024 occurred between September and December.
How Much Do Deer Crashes Increase in November?
Figures from the New York Department of Motor Vehicles (DMV) and Department of Environmental Conservation (DEC) show a pronounced increase during November 2024.
The agencies reported the following monthly counts of deer struck:
- October: 4,050
- November: 5,854
- December: 3,624
Based on those figures, November’s reported count was approximately 44.5% higher than October’s and 61.5% higher than December’s.
AAA Northeast separately identified 32,537 deer crashes in New York during 2024, more than 4% above its 2023 figure. Its analysis, released in 2026, used data from the Institute for Traffic Safety Management and Research.
Earlier state agency reporting presented a different annual deer count. Because the releases use different datasets or reporting methods, their figures should retain their original attributions rather than be treated as interchangeable.
State Farm’s national insurance research supports the broader seasonal pattern. Its 2026 findings identify November, October, and December as the three months when animal-collision claims involving large animals are most common.
How Fall Weather and Reduced Daylight Affect Deer Collisions
Shorter daylight hours create additional risks for drivers during deer season. By November, many motorists return home from work as the sun sets, making deer near wooded shoulders or roadside vegetation harder to recognize. Animals can also change direction suddenly or travel in groups, leaving drivers little time to react when another deer follows the first across the road.
The available research does not identify rain or snow as the primary cause of New York’s November crash peak. Historical FHWA research found that 95% of fatal animal-vehicle collisions in an older national analysis occurred during clear weather. Although that figure does not describe New York’s 2024 crashes, it demonstrates that fatal wildlife collisions can occur during clear weather and that precipitation is not a necessary condition for a serious crash.
The Deer Danger Zone: Sunset and Commuting-Hour Exposure
Nearly half of New York’s reported deer crashes occur during common commuting hours. AAA Northeast found that 48% of statewide deer crashes between 2021 and 2024 occurred during the combined hours of 6–10 a.m. and 3–7 p.m. These periods overlap with morning and afternoon travel to work, school, and other daily activities.
What New York’s Commute-Hour Deer Crash Data Reveals
New York’s DMV and DEC identify dawn and dusk as periods of increased deer and moose activity. Animals may travel between feeding areas and wooded cover during these hours, sometimes crossing roads at the same time vehicle traffic increases.
Visibility can also change quickly. Motorists may encounter shadows along wooded roadways, limited natural light, or glare from the setting sun. In late fall, earlier sunsets can place part of the afternoon commute in darkness, making roadside animals harder to recognize.
New York transportation guidance has identified deer-crash concentrations within approximately two hours before sunrise and after sunset. That guidance supports additional caution during periods of changing daylight, although it does not establish an exact number of crashes within a fixed interval surrounding sunset.
The 48% commute-window finding also requires context. Its two time ranges account for one-third of a 24-hour day, but the research does not adjust for traffic volume or miles traveled. More vehicles on the road during commuting periods can influence the number of collisions recorded.
On Long Island, earlier sunsets and increased deer activity can create hazards along roads that motorists use every day. The data supports additional caution during commuting hours, particularly in communities with documented deer-crash concentrations.
The Financial Cost of Wildlife-Vehicle Collisions
Wildlife collisions also create substantial financial consequences nationwide. In December 2024, the FHWA estimated that the United States experiences more than one million wildlife-vehicle collisions annually, resulting in approximately 200 deaths and 26,000 injuries each year in large-animal crashes under its broader estimation framework.
The agency placed the annual economic burden above $10 billion, including medical expenses, vehicle damage, and lost income. These figures represent broad national estimates rather than the specific 2024 fatality totals recorded by IIHS.
In December 2024, the FHWA announced $125 million for 16 wildlife-crossing projects designed to reduce collisions where animal habitats intersect major roads.
How Can Drivers Reduce Their Risk During Deer Season?
New York transportation and wildlife agencies recommend that motorists remain especially attentive during autumn, particularly around dawn and dusk.
Drivers can take several precautions:
- Watch the roadsides: Scan wooded areas, vegetation, and shoulders where deer may emerge.
- Reduce speed: Slower travel allows additional time to recognize animals and respond.
- Expect additional deer: Animals often travel in groups, and another may follow the first across the road.
- Maintain visibility: Use appropriate headlights and remain alert to changing light conditions.
- Avoid sudden swerving: Brake while maintaining control and staying in the travel lane when a collision cannot safely be avoided.
Abrupt steering maneuvers can introduce additional hazards, including leaving the roadway, overturning, or striking another vehicle. In some fatal crashes, the subsequent impact causes greater harm than the initial collision with the animal.
When an Animal Encounter Turns Into a Serious or Fatal Crash
In 2024, 210 people nationwide died in crashes that began with a collision involving an animal, according to the Insurance Institute for Highway Safety (IIHS). That was a 10.3% decrease from the 234 deaths recorded in 2023, although the figure remains considerably higher than the 89 deaths reported in 1975.
In some of these fatal crashes, the initial animal strike was followed by another event that caused greater harm, including rollovers and collisions with other vehicles or roadside objects.
Why Secondary Impacts Can Make Animal Crashes Deadly
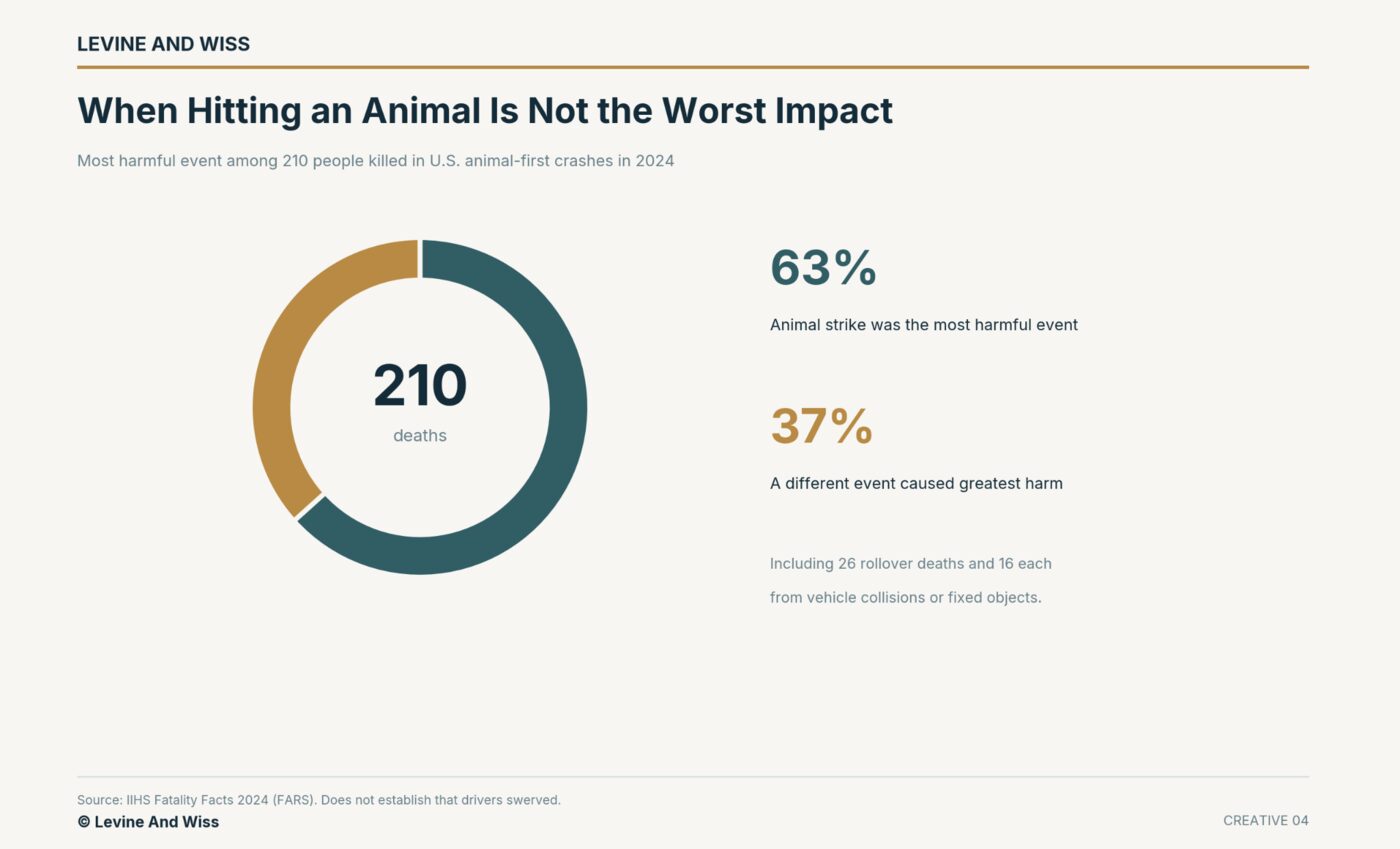
IIHS determined that the animal collision was the most harmful event in 133 of the 210 deaths, or approximately 63.3%. For the remaining 77 people, representing 36.7%, another event caused the greatest harm.
Those 77 deaths included:
- 26: Rollover was the most harmful event.
- 16: Collision with a fixed object was the most harmful event.
- 16: Collision with another moving vehicle was the most harmful event.
- 17: Another type of event caused the greatest harm.
- Two: Fire was the most harmful event.
The first harmful event refers to the initial damaging occurrence in a crash, whereas the most harmful event identifies the occurrence associated with the greatest harm.
A vehicle may strike a deer before colliding with a tree, overturning, or hitting another vehicle. In some cases, that subsequent impact produces more serious injuries than the original animal strike. These findings do not establish that every secondary collision resulted from a driver swerving, because the crash records do not identify the precise actions behind each incident.
AAA Northeast’s analysis of deer crashes in New Jersey and Massachusetts from 2020 through 2025 provides additional context. In New Jersey, approximately 4.5% of crashes involving a direct deer strike resulted in injuries, compared with more than 27% of crashes involving a swerve and subsequent impact.
Massachusetts showed a similar pattern. Just over 3% of direct-strike crashes resulted in injuries, compared with more than 19% of crashes involving swerving and another impact.
In both states, crashes involving a swerve and subsequent impact had higher reported injury percentages than direct deer strikes. The comparisons cover New Jersey and Massachusetts only, and the data does not establish that swerving caused every injury.
How Many Animal Crashes Cause Injuries in New York?
Of the 36,743 animal-related crashes reported statewide in 2024, AAA Western and Central New York identified 1,630 injury-resulting crashes and seven fatal crashes.
Injury crashes represented approximately 4.4% of the statewide total, based on our calculation. Injuries can include fractures, head trauma, and neck or back injuries, sometimes requiring hospitalization or extended recovery. The figures count injury-causing crashes rather than individual people injured, so one collision may involve multiple injuries.
How Do Animal-Collision Deaths Compare With Other Traffic Fatalities?
Animal strikes account for fewer national traffic deaths than several other major crash categories, but the figures use different definitions and require careful comparison.
National findings for 2024 include:
- 210 deaths: Crashes in which an animal strike was the first harmful event, according to IIHS.
- 7,979 deaths: Crashes in which a fixed-object collision was the most harmful event, according to IIHS.
- 11,288 deaths: Speeding-related crashes, according to NHTSA.
- 3,208 deaths: Crashes involving distracted drivers, according to NHTSA.
These categories use different definitions and can overlap. Speeding and distraction describe contributing behaviors, while animal strikes and fixed-object collisions describe crash events. A single collision can involve several of these circumstances, so the figures should not be added together as a national fatality total.
National Animal-First Crash Deaths by Quarter in 2024
New York’s reported deer crashes peak in November. For a broader comparison, IIHS reports the national number of people killed in animal-first crashes by calendar quarter in 2024.
IIHS recorded the following deaths during 2024:
- January–March: 25 deaths
- April–June: 65 deaths
- July–September: 67 deaths
- October–December: 53 deaths
The July–September quarter recorded the highest national total, with 67 deaths. However, these quarterly figures do not establish which individual month had the most animal-collision fatalities nationwide.
National fatality records cover different regions, animal species, and crash circumstances than New York’s deer-specific data. The July–September death total does not establish that summer carries the highest animal-collision risk nationwide, particularly because fatality counts and reported crash frequency measure different outcomes.
What the Findings Mean for Roadway Safety
Animal-collision patterns vary widely across the country, with significant differences even between neighboring Long Island counties. Suffolk County’s resident-adjusted crash frequency was 8.2 times Nassau County’s in 2024, and three Suffolk municipalities ranked among New York’s 10 highest for deer crashes from 2021 through 2024.
More than 20% of New York’s reported deer crashes occurred in November, while national fatality records show that the greatest harm can occur after the initial animal strike. The timing of these collisions and the possibility of secondary impacts both have implications for roadway safety.
What Drivers Should Do After an Animal Collision
New York’s DMV and DEC advise motorists involved in animal collisions to secure the scene, seek assistance when needed, and avoid approaching injured wildlife. Depending on the circumstances, drivers should seek medical attention, document vehicle damage and road conditions when safe, and follow applicable crash-reporting requirements.
The circumstances of an animal collision can also affect insurance and injury claims. An animal’s presence on the roadway does not automatically establish negligence by another driver, and incidents involving secondary impacts may require a closer examination of the entire crash sequence.
For people injured in crashes involving another motorist’s conduct, a Long Island car accident lawyer can explain how the available evidence, insurance coverage, and New York law relate to their situation.
Deer season brings increased wildlife activity to roads across New York, including those that drivers travel every day. The findings point to the value of monitoring local collision patterns, recognizing seasonal risks, and taking precautions when wildlife appears near traffic.
Data Sources
- State Farm — Animal Collision Likelihood and 2026 Rankings
- State Farm Newsroom — Animal Collision Data and Driver Safety
- AAA Northeast — Peak Deer Crash Season, October 2026
- AAA Western and Central New York — Watch for Wildlife
- AAA Northeast — Deer Mating Season and Driver Safety
- IIHS — Fatality Facts 2024, Collisions With Fixed Objects and Animals
- NHTSA — Speeding
- NHTSA — Distracted Driving
- FHWA — Wildlife-Vehicle Collision Reduction Study
- FHWA — Wildlife-Crossing Grants
- New York DMV and DEC — Fall Deer and Moose Safety Guidance
- Ithaca-Tompkins County Transportation Council — Transportation Statistics
- New York State DOT — Crash Analysis Toolbox
- Suffolk County Population Estimates — Federal Reserve Economic Data
- Nassau County Population Estimates — Federal Reserve Economic Data