
Men made up nearly three-quarters of passenger-vehicle driver deaths nationwide in 2024, but the gap between male and female fatalities varies significantly across the country. For its study, The Male Driver Fatality Gap Across America, Levine and Wiss reviewed federal crash records from 2020 through 2024 to compare all 50 states.
The rankings use data from the National Highway Traffic Safety Administration’s Fatality Analysis Reporting System and the Insurance Institute for Highway Safety. Each state received a Gender Crash Risk Index score based on male driver fatality rates, male fatal-crash involvement rates, and male-to-female driver fatality ratios.
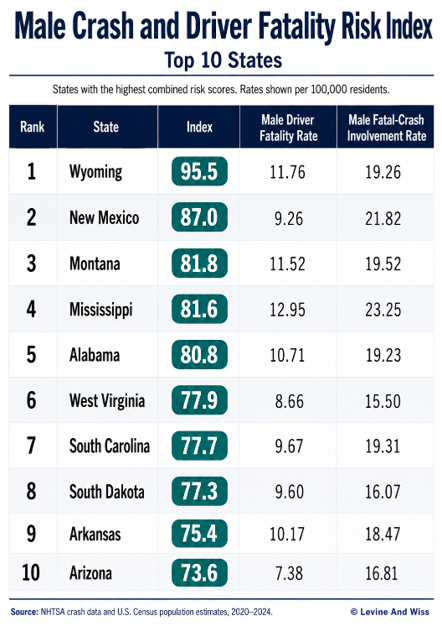
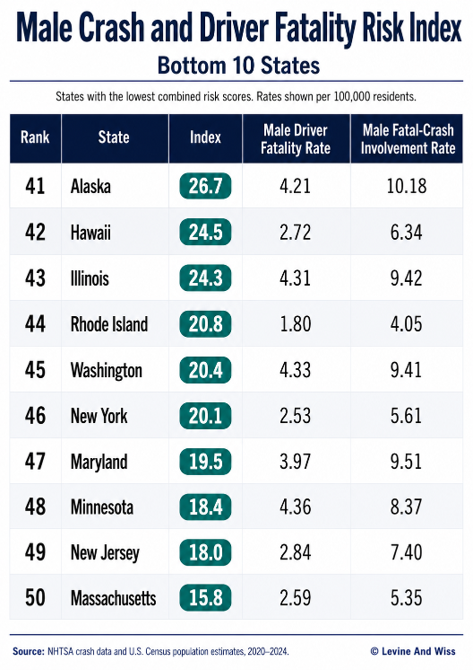
Wyoming ranks as the most dangerous state for male drivers based on the Gender Crash Risk Index, with a score of 95.5, while Massachusetts ranks as the safest state for male drivers with a score of 15.8.
America’s Gender Gap in Traffic Fatalities: Where Men Face the Greatest Risk
Our Gender Crash Risk Index ranks all 50 states using rate-based measures per 100,000 residents, weighted across male driver fatality rates, male fatal-crash involvement rates, and the male-to-female driver fatality gap from 2020 to 2024. Rates are used rather than raw totals so larger states do not rise to the top solely because of population size.
Key national figures from our analysis of NHTSA and IIHS data:
- U.S. traffic crashes killed 39,254 people in 2024, including 28,385 males and 10,764 females.
- Men represented 72% of passenger-vehicle driver deaths and 66% of passenger-vehicle occupant deaths.
- The 2024 male driver fatality rate was 5.73 per 100,000 residents; the female rate was 1.51.
- Male crash deaths have exceeded female deaths by more than two to one in nearly every year since 1975.
Top 10 Riskiest States for Male Drivers
10 Safest States for Male Drivers
Why Are Men More Likely to Die in Crashes? The Behaviors Behind the Numbers
The higher fatality rate among male drivers does not trace back to a single behavior. Alcohol impairment, speeding, distraction, and aggressive driving all appear throughout the crash data, with men accounting for a larger share of several behaviors causing deadly collisions.
Alcohol Impairment
Alcohol appears frequently in fatal crashes involving male drivers, especially on weekends. The gap between men and women also appears among fatally injured passenger-vehicle drivers, suggesting impaired driving is one factor behind the higher fatality rate among men.
- 34% of fatally injured male passenger-vehicle drivers had BACs at or above 0.08%, compared with 24% of female drivers.
- On weekends, 43% of fatally injured male passenger-vehicle drivers had BACs at or above 0.08%.
Speeding
Speeding stands out among younger male drivers. Higher speeds leave drivers with less time to react and increase the force of the collision, making this behavior especially relevant when examining why fatal crashes involve so many young men.
- Among male drivers in fatal crashes, 39% of those ages 15–20 and 34% of those ages 21–24 were speeding.
- Approximately 60% of men fall into the “Speeding Drivers and Most Dangerous Drivers” category in AAA research.
Distracted Driving
Distraction affects drivers of both sexes, but men accounted for nearly three-quarters of distracted drivers involved in fatal crashes in 2024. That share adds another piece to the larger pattern seen throughout the study.
- Men represented 73% of distracted drivers involved in fatal crashes in 2024.
- Distracted driving killed 3,208 people and injured an estimated 315,167 that year.
Road Rage and Risk-Taking:
Survey data also shows a wider gap in several aggressive driving behaviors. Men report road rage at higher rates overall, with some of the largest differences appearing in more dangerous actions behind the wheel.
- More than half (55%) of male drivers admit to road rage behaviors, compared with 46% of female drivers.
- Twice as many men reported confronting another driver or intentionally ramming another vehicle.
Where the Risk Is Highest: Crash Types, Roads, and Vehicles
Vehicle type also appears in the fatality data, particularly in crashes involving pickups, SUVs, motorcycles, and large trucks.
Men made up 72.2% of all passenger-vehicle driver deaths in 2024. Pickups and SUVs had higher rates of rollover involvement among occupant deaths than passenger cars:
- Rollover crashes were involved in 38% of pickup occupant deaths and 33% of SUV deaths, compared with 20% of car occupant deaths.
- 66% of pickup occupant deaths occurred on rural roads.
- Single-vehicle crashes accounted for 54% of pickup occupant deaths.
- Men made up 96.2% of large-truck driver deaths — 750 of the 780 recorded in 2024.
More male drivers were involved in fatal crashes at night, with 20,528 nighttime involvements compared with 19,931 during the day. Separate data also shows substantial male involvement on rural roads, interstates, and major arterial roads.
10 Deadliest U.S. Highways Based on 2019 Fatality Data
Road types add another piece of context. In 2024, men accounted for 75.16% of known-sex drivers involved in fatal crashes, including thousands on interstates, freeways, and major arterial roads. The highway ranking below is not male-specific, but it shows where fatal crashes have historically been concentrated on major U.S. roadways.
NHTSA crash data from 2016 through 2019 identified the following highways as the deadliest based on 2019 fatalities per 100 miles:
- I–95: 284 fatalities; 14.88 fatalities per 100 miles
- I–20: 208 fatalities; 13.52 fatalities per 100 miles
- I–5: 186 fatalities; 13.47 fatalities per 100 miles
- I–75: 237 fatalities; 13.27 fatalities per 100 miles
- I–35: 197 fatalities; 12.56 fatalities per 100 miles
- I–15: 158 fatalities; 11.02 fatalities per 100 miles
- I–40: 253 fatalities; 9.89 fatalities per 100 miles
- I–70: 158 fatalities; 7.35 fatalities per 100 miles
- I–80: 209 fatalities; 7.21 fatalities per 100 miles
- US–41: 141 fatalities; 7.02 fatalities per 100 miles
Who Is Most at Risk? Age and Lifestyle Factors
Age significantly shapes male crash risk. From our analysis of NHTSA and IIHS data:
- Among passenger-vehicle occupants ages 16–19, the death rate was 19.6 per 100,000 males compared with 7.3 for females.
- Males aged 20–24 recorded the highest occupant death totals in 2024: 1,740, at a rate of 15.2.
- Teenagers accounted for 2,899 crash deaths in 2024, with males representing roughly three-quarters of those fatalities.
- Men traveled an average of 31.0 miles per day in 2022, compared with 26.2 for women.
- In 2022, the male fatal-crash involvement rate per 100 million miles driven was 48% higher than the female rate.
Fatal crash involvement among male drivers also spikes around specific holidays. Here’s the breakdown for four major 2024 holiday periods, ranked by the number of male drivers involved:
- Independence Day: 572
- Labor Day: 499
- Thanksgiving: 462
- Memorial Day: 435
Closing the Gap: What New York and Other States Are Doing
State-level policies can address several factors associated with fatal crashes, and New York has taken measurable steps aimed at speeding among younger drivers.
In New York, male drivers ages 16 to 24 were involved in 58,182 crashes in 2024, compared with 35,494 female drivers in the same age group. Nationwide, 39% of male drivers ages 15 to 20 involved in fatal crashes were speeding. Governor Hochul also announced Speed Week 2, an enforcement campaign specifically targeting dangerous speeds on New York roads.
Nationally, several policies show measurable impact on crash outcomes:
- All 50 states and D.C. have three-stage graduated driver licensing systems, which can reduce teen crash risk by up to 50%.
- 34 states mandate ignition interlocks for all impaired-driving offenders.
- NHTSA’s new automatic emergency braking rule is estimated to save at least 360 lives per year.
- IIHS estimates that optimal seat-belt enforcement in every state could have saved 277 lives in 2023 alone.
The Gender Crash Risk Index shows how drastically male driver risk varies by state, from Wyoming’s 95.5 score to Massachusetts’ 15.8. Men still accounted for 72% of passenger-vehicle driver deaths nationwide in 2024, showing that the fatality gap extends across states and driving behaviors.
For people injured in crashes involving speeding, impairment, distraction, or aggressive driving, a Long Island car accident lawyer can review what happened and explain the options available.